
Kubernetes changed how teams deploy software. It did not change how most observability vendors price it. New Relic charges $49 to $349/month for full platform access per user, and the newer Compute Capacity Unit model introduces billing dimensions that spike during incidents – precisely when your team is running the most queries across pods, nodes, and services.
For cloud-native teams, the pain is structural. Dynamic infrastructure means ephemeral pods, auto-scaling node pools, and service mesh sidecars generating telemetry volumes that are hard to predict and expensive to send to SaaS platforms. Add NRQL lock-in (every dashboard and alert is non-portable) and a SaaS-only architecture that may not satisfy data residency requirements, and the case for evaluating alternatives becomes practical, not theoretical.
This guide evaluates seven alternatives through a Kubernetes and cloud-native lens: CubeAPM, Datadog, Dynatrace, Grafana Cloud, IBM Instana, Elastic APM, and Honeycomb. Each tool is assessed on pod-level monitoring, container observability, service mesh support, dynamic infrastructure handling, and what it actually costs when your cluster scales.
*Estimates based on 30TB/month ingestion, 100 hosts, 20 users, 30-day retention. Full methodology at end of article.*
Kubernetes Capabilities at a Glance
Before diving into individual tools, here is how each platform handles the Kubernetes-specific requirements that matter most to cloud-native teams:
| Tool | Pod/Container Monitoring | Service Mesh Visibility | Dynamic Infra Scaling | Container Dashboards | K8s-Specific Pricing |
|---|---|---|---|---|---|
| CubeAPM | Native OTel-based | Via OTel instrumentation | Auto-discovery | Built-in K8s views | Included ($0.15/GB) |
| Datadog | Native (Agent) | Istio, Envoy, Linkerd | Auto-scaling aware | K8s Explorer | $15/host/mo + add-ons |
| Dynatrace | OneAgent auto-inject | Istio, Envoy support | Auto-discovery | K8s classic/app views | $0.002/hr per pod |
| Grafana Cloud | Alloy + Prometheus | Via service graph | Label-based | Custom Grafana panels | $0.01/host hour |
| IBM Instana | Agent auto-discovery | Istio, Envoy, Consul | 1-second granularity | Dynamic graph | Per-MVS licensed |
| Elastic APM | Elastic Agent + OTel | Via trace correlation | Manual config | Kibana dashboards | Deployment-based |
| Honeycomb | OTel Collector | Trace-based only | Event-driven | Query-based views | Usage-based |
* Kubernetes monitoring complexity grows with cluster size. Ephemeral pods, auto-scaling, and service mesh sidecars multiply both telemetry volume and the billing dimensions most vendors charge on.
1. CubeAPM
Best for: DevOps and platform teams that want full-stack observability inside their own cloud without SaaS data egress, pricing sprawl, or DIY self-hosting overhead
Overview
CubeAPM is a self-hosted, OpenTelemetry-native, full-stack observability platform that runs inside your own AWS, GCP, or Azure VPC. Traces, logs, and metrics never leave your infrastructure boundary – which means zero cloud egress cost and full data sovereignty by architecture, not by policy. CubeAPM handles upgrades, patches, and platform operations; you provide the infrastructure.
Kubernetes and Cloud-Native Fit
CubeAPM ingests Kubernetes telemetry natively via OpenTelemetry, giving teams pod-level traces, container metrics, and node health in a single platform. Because it runs in-VPC, the telemetry generated by ephemeral pods and auto-scaling node pools stays inside your infrastructure – no egress fees scaling with cluster size. At 30TB/month, that saves ~$3,000/month in cloud data-out charges alone compared to any external SaaS platform.
Ranked in the top 10 APM platforms in G2’s Spring 2026 APM Grid Report. Capterra 5/5, G2 5/5, and #4 easiest-to-use APM tools on G2. Used by Policybazaar (insurance), Delhivery ($3.5B logistics – 75% savings after replacing three separate monitoring tools), Mamaearth ($1.2B), world’s largest bus aggregator – redBus (part of MakeMyTrip Limited (NASDAQ: MMYT), 8+ countries), Ola, and Practo (healthcare). SOC 2 Type II and ISO 27001 certified.
Key Features
- Full MELT observability: Metrics, events, logs, and traces in one platform with a single investigation workflow
- OpenTelemetry-native: Compatible with OpenTelemetry, Datadog, New Relic, Elastic, and Prometheus agents for incremental migration
- Self-hosted, vendor-managed: Deploys in your VPC. Your monitoring stays up even if the internet doesn’t
- AI-based Smart Sampling: Reduces low-value telemetry volume while preserving high-value traces – critical for K8s environments generating high trace volumes from sidecar proxies
- Unlimited retention: Included in pricing – no separate retention charges
- MCP server: CubeAPM provides an MCP server that customers can use to query CubeAPM in natural language
- 800+ integrations: Kubernetes, synthetic monitoring, RUM, and error tracking included
Pricing
Ingestion-based pricing of $0.15/GB. No per-user fees. No per-host charges. Unlimited users and unlimited data retention included. Single billing dimension – no surprises from metrics, hosts, or users.
At 30TB/month: ~$5,100/month all-in ($4,500 license + ~$600 infra)
Delhivery: 75% savings after replacing three separate monitoring tools. Mamaearth: ~70% savings, migrated in under an hour. redBus: 4x faster dashboards, 50% faster MTTR.
“Dashboards are astonishingly fast compared to New Relic – the migration process was also super smooth.”
Direct engineering support via WhatsApp and Slack channels – responds in minutes during incidents.
Pros
- 70-75% lower cost than enterprise APM at scale
- Complete data ownership; telemetry never leaves your VPC
- Predictable pricing with no hidden billing dimensions
- Zero cloud egress cost; critical for K8s clusters generating high telemetry volume
- Fast migration – multiple customers report under an hour setup
Cons
- Requires self-hosted deployment in cloud or on-prem; may not suit teams looking for a SaaS-only model
- AI/ML anomaly detection is growing but not as mature as Dynatrace Davis AI.
- SSO/RBAC less mature than enterprise SaaS incumbents
2. Datadog
Best for: Cloud-native teams that want the broadest SaaS ecosystem with deep Kubernetes integrations – and have the budget to manage billing complexity at scale
Overview
Datadog is the largest commercial observability platform and New Relic’s most direct competitor for Kubernetes-heavy teams. Its integration catalog (900+) and feature breadth are unmatched – APM, logs, security, RUM, synthetics, and network monitoring under one roof. The Kubernetes Explorer provides pod, deployment, and resource-level visibility that most teams find strong out of the box.
Kubernetes and Cloud-Native Fit
Datadog’s Kubernetes monitoring is among the strongest in the category. The Datadog Agent runs as a DaemonSet, collecting pod metrics, container logs, and cluster-level events automatically. Kubernetes Explorer surfaces pod health, deployment status, and resource utilization in purpose-built views. Service mesh integrations (Istio, Envoy, Linkerd) are mature, and auto-scaling events are tracked natively. The trade-off: host-based APM pricing compounds quickly as clusters grow, and OTel metrics are often billed as custom metrics.
Key Features
- Kubernetes Explorer with pod, deployment, and resource-level visibility
- 900+ integrations; largest ecosystem in the category
- Native service mesh support: Istio, Envoy, Linkerd
- Network Performance Monitoring for container-to-container traffic
- Watchdog AI proactively surfaces anomalies across K8s services
Pricing
Multi-dimensional billing: hosts + custom metrics + log ingestion ($0.10/GB) + log indexing (~$1.70/million events) + APM spans + RUM sessions. OTel metrics are often billed as custom metrics.
At 30TB/month: ~$30,000-$45,000+/month
Breakdown (30% logs indexed): 100 hosts ~$2,400 + log ingest 20TB ~$2,000 + log indexing ~$30,000 + APM spans ~$3,000-5,000 + custom metrics ~$5,000+. Log indexing is the dominant cost driver. For K8s teams, host count directly scales the APM bill.
Pros
- Best-in-class Kubernetes Explorer and container monitoring
- Deepest service mesh integrations in the market
- Broadest integration ecosystem for cloud-native toolchains
- Mature CI/CD and deployment tracking for K8s releases
Cons
- Host-based APM pricing compounds quickly as K8s clusters scale – each node is a billable host.
- OTel metrics billed as custom metrics – adds cost for teams adopting open standards
- SaaS-only; telemetry leaves your infrastructure; self-hosted platforms eliminate this for teams with data residency needs.
- Total cost at 30TB+ significantly exceeds alternatives with per-GB pricing models.
3. Dynatrace
Best for: Large enterprises running complex Kubernetes estates that need AI-automated root cause analysis across dynamic infrastructure
Overview
Dynatrace differentiates with its Davis AI engine, which automatically maps service dependencies and performs causal root-cause analysis across Kubernetes workloads. Gartner ranks Dynatrace highest in “Ability to Execute” among observability vendors. The Dynatrace Operator deploys flexibly across K8s clusters with options for full-stack, application-only, or cloud-native monitoring modes.
Kubernetes and Cloud-Native Fit
Dynatrace’s Kubernetes monitoring starts with the Dynatrace Operator, which handles OneAgent injection into pods automatically. The platform provides dedicated Kubernetes views covering cluster health, workload status, and resource quotas. Davis AI correlates pod restarts, OOM kills, and resource contention to root causes without manual investigation. The K8s Platform pricing at $0.002/hour per pod is transparent but can accumulate quickly in clusters with thousands of pods.
Key Features
- Davis AI: Automatic baselining, anomaly detection, and causal root-cause analysis across K8s workloads
- Dynatrace Operator with flexible deployment modes for Kubernetes
- Automatic pod injection; no manual instrumentation per service
- Dedicated K8s classic and application views for cluster health
- OpenTelemetry support via OTLP API, OTel Collector, and Dynatrace Collector
Pricing
Usage-based with separate rate-card units. Full-Stack Monitoring at $0.01/memory-GiB-hour, K8s Platform at $0.002/hour per pod, Log Management ingest/process at $0.20/GiB, retain at $0.0007/GiB-day.
At 30TB/month: ~$20,000-$35,000+/month
Breakdown: 100 hosts x $0.08/hr x 8 GiB x 730 hrs ~$4,700 + log ingest 20TB x $0.20/GiB ~$4,100 + log retention ~$430 + traces/metrics/APM + K8s pod hours + commitment overhead.
Pros
- Best automated root cause analysis for dynamic Kubernetes environments
- Automatic pod injection eliminates per-service instrumentation overhead
- Managed deployment option for data residency (Dynatrace Managed)
- Strong compliance and enterprise security features
Cons
- Proprietary OneAgent creates vendor lock-in; harder to move to OTel-native backends later.
- Memory-GiB-hour pricing is harder to forecast than simple per-GB models.
- Per-pod K8s pricing accumulates in large, dynamic clusters.
- Davis AI requires a baselining period; new clusters do not get full value immediately.
4. Grafana Cloud (LGTM Stack)
Best for: Cloud-native teams that want OTel-native dashboarding with Prometheus-compatible metrics and open-source foundations
Overview
Grafana Labs assembled the LGTM stack – Loki (logs), Grafana (dashboards), Tempo (traces), Mimir (metrics) – into a coherent observability platform. Paired with Grafana Alloy (an OTel Collector distribution), it provides dedicated OTLP endpoints that auto-route signals to the right backend. For Kubernetes teams already running Prometheus, Grafana Cloud is the natural extension to full observability without a forklift migration.
Kubernetes and Cloud-Native Fit
Grafana Cloud’s Kubernetes monitoring builds on its Prometheus heritage. Grafana Alloy collects K8s metrics, logs, and traces via a single agent deployed as a DaemonSet. Prometheus-format metrics from kube-state-metrics and node-exporter flow natively into Mimir. Pre-built Kubernetes dashboards cover cluster, namespace, pod, and container views. The self-hosted path lets teams keep all telemetry in-VPC, though operating the LGTM stack at scale requires dedicated SRE capacity.
Key Features
- LGTM stack: Mimir for metrics, Loki for logs, Tempo for traces – all Kubernetes-aware
- Grafana Alloy: OTel Collector distribution with built-in Prometheus pipelines for K8s
- Strongest dashboarding and visualization across multiple telemetry sources
- k6 performance testing integrated for load testing K8s services
- Cost attribution features for tracking telemetry spend by namespace or team
Pricing
Usage-based across telemetry types. Logs: $0.05/GB process + $0.40/GB write + $0.10/GB retain. Traces: same structure. Metrics: $6.50/1k active series. K8s: $0.01/host hour. Platform fee: $19/month.
At 30TB/month (managed cloud): ~$15,000-$20,000+/month
Breakdown: 20TB logs ~$11,000 + 7TB traces ~$3,500 + 500K metric series ~$4,000 + base. Adaptive Metrics/Logs features can reduce this materially.
Pros
- Fully OTel-native; no custom metrics penalty for Kubernetes workloads
- Pre-built K8s dashboards with deep Prometheus compatibility
- Adaptive Metrics/Logs actively help reduce billing
- Self-hosted path available for cost-driven teams with operational capacity
Cons
- No native APM out-of-the-box; requires significant configuration for K8s tracing
- Self-hosting LGTM at scale requires dedicated SRE expertise.
- Usage-based pricing still grows with volume on managed cloud as clusters scale.
- LGTM stack has a steep learning curve for teams new to the Grafana ecosystem.
5. IBM Instana
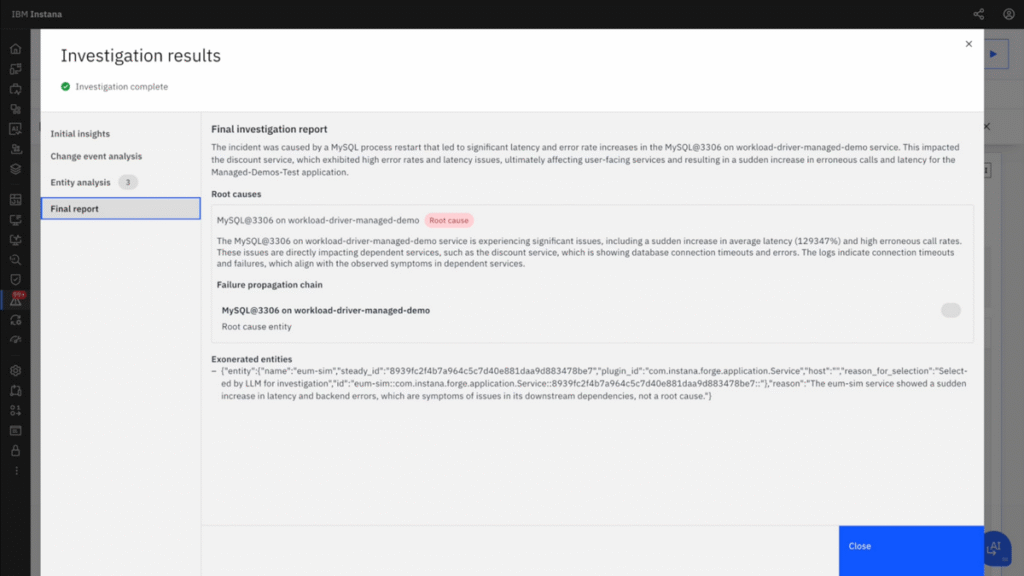
Best for: Enterprises with complex hybrid and multi-cloud Kubernetes environments that need automatic discovery and 1-second granularity
Overview
IBM Instana is positioned as full-stack observability powered by agentic AI. It automatically discovers and maps service dependencies across 300+ technologies without manual configuration. For Kubernetes teams running hybrid or multi-cloud clusters, Instana’s automatic pod and container discovery with 1-second metric granularity provides real-time visibility that most platforms aggregate away.
Kubernetes and Cloud-Native Fit
Instana’s Kubernetes monitoring deploys an agent that automatically discovers pods, containers, and services across clusters. Service mesh integrations (Istio, Envoy, Consul) are built in. The dynamic dependency graph updates in real time as pods scale up, crash, and redeploy – no manual map maintenance required. The 1-second metric granularity captures brief pod lifecycle events that 15- or 60-second scrape intervals miss entirely. All OpenTelemetry signals (traces, metrics, logs) are generally available.
Key Features
- Automatic discovery: Agents detect pods, containers, and dependencies across 300+ technologies without config
- 1-second granularity: Captures brief K8s lifecycle events that longer scrape intervals miss
- Service mesh support: Istio, Envoy, Consul integration
- Agentic AI incident investigation (preview)
- Synthetic monitoring with managed global points of presence
Pricing
Licensed by Managed Virtual Server (MVS). Logs from $0.35/GB. Minimum 10 hosts. Unlimited users. Fair-use: 325 GB/Standard SaaS MVS/month.
At 30TB/month: ~$10,500/month (range $10.5K-$37K depending on MVS count and log volume)
Pros
- Best automatic service discovery for complex K8s + multi-cloud estates
- 1-second granularity captures ephemeral pod events that other tools miss
- Strong service mesh and hybrid cloud support
- Self-hosted option available for data residency
Cons
- Host-based MVS licensing means costs scale with node count, not telemetry volume.
- Some agentic AI capabilities still in preview
- Enterprise-oriented; may be heavier than cloud-native teams need
- Minimum 10-host commitment may not fit smaller K8s deployments.
6. Elastic APM
Best for: Teams already on the ELK stack who want to add Kubernetes APM without introducing another vendor
Overview
Elastic APM is the distributed tracing and application monitoring component of the Elastic Stack. For teams already indexing Kubernetes logs in Elasticsearch and visualizing in Kibana, adding APM extends their existing investment. It provides distributed tracing, service maps, error tracking, and MELT correlation.
Note: Elastic APM’s OSS version reached end-of-service in September 2025 – evaluate managed options carefully for new K8s deployments.
Kubernetes and Cloud-Native Fit
Elastic’s Kubernetes monitoring uses the Elastic Agent or OpenTelemetry to collect pod metrics, container logs, and traces. The APM data correlates directly with log indices in Elasticsearch, which is valuable for teams already running ELK for Kubernetes log aggregation. ML-based anomaly detection can flag pod resource contention and service degradation. The self-hosted option (SSPL license) keeps all K8s telemetry in your infrastructure, though operational overhead at scale is significant.
Key Features
- Native Elasticsearch integration: K8s APM data correlates directly with log indices
- OpenTelemetry compatible across serverless, self-managed, and hybrid deployments
- Machine learning-based anomaly detection for K8s workloads
- RUM via JavaScript agent for frontend services running on K8s
- Available self-hosted (SSPL license) or Elastic Cloud
Pricing
Self-hosted is free; you cover infrastructure. Elastic Cloud: consumption-based. Serverless Observability: Logs Essentials from $0.07/GB ingested + $0.017/GB retained/month.
At 30TB/month (Elastic Cloud): ~$8,000-$15,000/month
Pros
- Zero incremental cost if already running Elastic for K8s logs
- Strong log + trace correlation in the same query interface
- Self-hosted option keeps all Kubernetes telemetry on your infrastructure
- ML-based anomaly detection included
Cons
- Significant operational overhead to run self-hosted at scale with high K8s telemetry volume
- Kibana Query Language (KQL) is less developer-friendly than SQL or PromQL.
- 2021 SSPL licensing change – review for open-source compliance
- APM experience is less polished than purpose-built APM tools; teams using self-hosted alternatives with vendor-managed operations may find less operational burden.
7. Honeycomb
Best for: Cloud-native teams that need high-cardinality debugging across distributed Kubernetes services
Overview
Honeycomb takes a fundamentally different approach to observability: it stores wide events and derives trace, log, and metric views from a single data model. This makes it exceptionally powerful for debugging high-cardinality distributed systems where traditional APM sampling loses the signal. Honeycomb is OpenTelemetry-first, with OTel as the primary instrumentation standard. A private cloud option was announced in November 2025 for teams with data residency requirements.
Kubernetes and Cloud-Native Fit
Honeycomb’s wide-event model is well suited to Kubernetes debugging. When a request traverses multiple pods across namespaces, Honeycomb captures the full trace context with arbitrary attributes – pod name, namespace, node, deployment version – without the cardinality limits that force other platforms to drop dimensions. BubbleUp automatically identifies which K8s attributes (pod, node, region) correlate with latency outliers. The trade-off: Honeycomb is primarily a tracing and debugging platform, not a full infrastructure monitoring solution for cluster health and node metrics.
Key Features
- OpenTelemetry-first: OTel is the primary and recommended instrumentation standard for K8s workloads
- Wide events: High-cardinality K8s attributes (pod, namespace, node) stored without sampling
- BubbleUp: Automated outlier detection across K8s dimensions – finds which pods or nodes cause latency spikes
- Unified telemetry: Traces, logs, and metrics navigated in one workflow
- Private cloud option (announced November 2025) for data residency
Pricing
Usage-based, starts at $0.10/GB ingested. Cost scales with telemetry volume.
At 30TB/month: ~$5,600/month (can range $5K-$24K depending on event volume and plan)
Pros
- Exceptional for debugging distributed K8s services with high-cardinality attributes
- Strong OpenTelemetry-first product direction
- BubbleUp surfaces K8s-specific outliers automatically
- Wide event model avoids the cardinality limits of metric-based platforms
Cons
- Primarily a tracing and debugging platform, not full infrastructure monitoring for K8s cluster health
- SaaS-only (private cloud option announced but still early)
- Teams looking for a dashboard-first K8s monitoring experience may find Honeycomb’s workflow different.
- No built-in infrastructure metrics for node, pod, or container resource monitoring
Cost Comparison at 30TB/Month Ingestion
| Tool | Est. Cost @ 30TB/mo | Pricing Model | OTel Native | Data Residency | Self-Hosted |
|---|---|---|---|---|---|
| CubeAPM | ~$5,100/mo all-in | $0.15/GB ingestion-based | Native | Always (in-VPC) | Yes (vendor-managed) |
| Datadog | ~$30K-$45K+ | Host + feature-based | Partial* | SaaS only | No |
| Dynatrace | ~$20K-$35K+ | GiB-hour + commit | Partial | Managed option | Managed |
| Grafana Cloud | ~$15K-$20K+ | Usage-based | Native | If self-hosted | Yes |
| IBM Instana | ~$10.5K-$37K | Per-MVS host | Yes (GA) | Self-hosted option | Yes |
| Elastic APM | ~$8K-$15K | Deployment-based | Partial | If self-hosted | Yes |
| Honeycomb | ~$5K-$24K | Usage-based | Native | Limited | Limited |
| New Relic (ref.) | ~$20K-$25K+ | Ingest + per-user | Partial | SaaS only | No |
* OTel metrics in Datadog are often billed as custom metrics. New Relic included as reference. All estimates use the methodology assumptions above. Vendor discounts and EDP commitments can significantly reduce SaaS costs.
What New Relic Actually Costs at Your Team Size
Most comparison guides show pricing tiers. What they do not show is how those tiers combine – data ingest + user seats + synthetics + cloud egress – into a real monthly bill. For Kubernetes teams, the problem compounds: ephemeral pods and auto-scaling nodes push telemetry volumes higher than static infrastructure.
| Team Profile | Data / Users | New Relic /mo | CubeAPM /mo | Annual Saving | Saving % |
|---|---|---|---|---|---|
| Small team | 500 GB, 3 users | ~$458 | ~$75 | ~$4,596/yr | ~84% |
| Growing team | 5 TB, 10 users | ~$4,955 | ~$750 | ~$50,460/yr | ~85% |
| Mid-market | 30 TB, 50 users | ~$24,745 | ~$4,500 | ~$242,940/yr | ~82% |
| Enterprise | 200 TB, 150 users | ~$97,750 | ~$30,000 | ~$813,000/yr | ~69% |
New Relic costs: Standard plan, Original data ($0.40/GB beyond 100GB free), full platform users at $99 to $349 per user per month for full platform access. CubeAPM: $0.15/GB, no user fees. Enterprise pricing may include negotiated discounts not reflected here.
If you want to model your current New Relic bill before committing to a switch, the New Relic pricing calculator breaks down every cost dimension: data ingest, user seats, synthetics, and cloud egress fees most teams overlook.
The Hidden Cost: Cloud Data-Out Egress
When you send telemetry to any external SaaS platform – New Relic, Datadog, or any cloud-hosted alternative – your cloud provider charges approximately $0.10/GB for data leaving your VPC. At 30TB/month, that is $3,000/month in AWS or GCP egress fees, which does not appear on your observability invoice. For Kubernetes clusters, this cost is especially painful: dynamic pod scaling generates telemetry spikes that directly translate to egress spikes. Self-hosted platforms running inside your VPC have zero data-out cost.
How to Migrate from New Relic to an OTel-Native Platform
Migration anxiety is real – you have built dashboards, tuned alerts, and accumulated operational knowledge in New Relic over months or years. The good news: switching to an OpenTelemetry-native platform is structurally less painful for Kubernetes teams. Your services already emit structured telemetry via OTel Collectors or sidecar agents. Pointing that data at a new backend is often a configuration change rather than re-instrumentation.
| Week | Focus | Key Actions | Exit Criteria |
|---|---|---|---|
| 1 | Instrument inventory | List every service using NR agents. Map data volumes per service. Choose target platform. | Full inventory. Platform selected. |
| 2 | Parallel run | Deploy OTel Collector alongside NR agents on 1-2 non-critical services. Dual-write telemetry. Compare dashboards. | Traces/metrics parity confirmed on pilot services. |
| 3 | Dashboard migration | Recreate top 10 critical dashboards and all active alerts. Validate alert accuracy. Remove NR agents from pilot services. | Critical dashboards live. Alert parity verified. |
| 4 | Full cutover | Roll OTel agents to remaining services. Cancel NR agents service-by-service. Run NR in read-only mode for 2 weeks. | All services on new platform. NR agents decommissioned. |
Practical note: Run both platforms simultaneously for at least two weeks before cancelling New Relic. Teams consistently discover dashboards they forgot existed, alerts that were silently firing, or integrations that depended on NR’s API. Document what each dashboard is measuring, not the NRQL syntax, before migrating.
Which New Relic Alternative Is Right for Your Kubernetes Team?
- Choose CubeAPM if cost predictability and data sovereignty are priorities. Ingestion-based, predictable pricing of $0.15/GB, unlimited users, runs in-VPC with zero egress cost – K8s telemetry stays inside your infrastructure.
- Choose Datadog if you need the broadest K8s monitoring ecosystem with deep service mesh integrations. Model host-based and custom metrics costs carefully before committing.
- Choose Dynatrace if enterprise AI automation and causal root-cause analysis across complex K8s estates are your primary needs. Factor in per-pod pricing for large clusters.
- Choose Grafana Cloud if your K8s team already runs Prometheus and wants to extend to full observability with flexible dashboards and OTel-native pipelines.
- Choose IBM Instana if you run hybrid or multi-cloud Kubernetes environments and need automatic discovery with 1-second granularity across 300+ technologies.
- Choose Elastic APM if your team already runs ELK for K8s log aggregation and wants to add distributed tracing without a new vendor.
- Choose Honeycomb if your primary challenge is debugging distributed K8s services with high-cardinality attributes. Best for teams that think in events and traces.
When New Relic Is Still the Better Choice
New Relic is still the right choice for Kubernetes teams that want a broad commercial observability platform with strong full-stack coverage in one SaaS environment.
- If the free tier offering 100GB free per month is sufficient for your use case.
- You want one vendor covering APM, infrastructure, browser, synthetics, Kubernetes, and incident workflows in one place.
- You are already heavily invested in the New Relic ecosystem (dashboards, alerts, NRQL queries) and migration cost exceeds the pricing delta.
- You need native OTLP ingest inside a commercial SaaS platform without moving to a self-managed stack.
- You need mature synthetic monitoring with scripted browser/API tests and private locations.
- You are comfortable actively managing telemetry volume, CCU consumption, and ingest governance as your K8s clusters scale.
- You want AI-assisted observability (New Relic AI, alert-coverage analysis) built natively into the platform.
Final Thoughts
Kubernetes teams have a different calculus when evaluating observability platforms. Dynamic infrastructure means telemetry volume is harder to predict, pod-level visibility is non-negotiable, and host-based or per-pod pricing models can surprise you as clusters auto-scale.
The practical decision tree for cloud-native teams is straightforward. If compliance or data residency is a hard requirement, self-hosted platforms running inside your VPC are the only structurally viable option – most SaaS alternatives do not solve this. If cost is the primary driver, model your bill across data volume, node count, pod hours, and cloud egress before committing – the gap between GB-based pricing and multi-dimensional billing grows wider at Kubernetes scale. If enterprise AI automation across complex K8s estates is the priority, the AI-led platforms justify their premium. If high-cardinality debugging across distributed services matters most, newer OTel-first platforms offer a fundamentally different investigation model.
Compare your top two options against your actual cluster telemetry volume, deployment requirements, and budget before making the switch. The numbers at your Kubernetes scale will make the decision clearer than any feature matrix.
Methodology
*Methodology: 30TB/month (~20TB logs, 7TB traces, 3TB metrics), 30% log indexing, 500K metric series, core observability only. Based on public rate cards, early 2026. Vendor discounts and EDP commitments can significantly reduce SaaS costs.*
Frequently Asked Questions
1. Which New Relic alternative is best for Kubernetes monitoring?
It depends on your priorities. For the broadest K8s-specific features and service mesh integrations, Datadog leads. For AI-automated root cause analysis across dynamic clusters, Dynatrace. For cost predictability with data sovereignty, self-hosted OTel-native platforms keep telemetry in-VPC with zero egress cost. For Prometheus-native teams, Grafana Cloud extends existing workflows.
2. How does Kubernetes monitoring affect observability costs?
Significantly. Ephemeral pods, auto-scaling node pools, and service mesh sidecars multiply telemetry volume in ways that are hard to predict. Platforms with host-based or per-pod pricing compound this – each node and pod becomes a billable dimension. Per-GB pricing models are more predictable for K8s teams because they charge on actual data volume rather than infrastructure count.
3. Can I use OpenTelemetry for Kubernetes monitoring?
Yes, and it is the recommended approach for vendor-neutral K8s observability. The OTel Collector deploys as a DaemonSet or sidecar, collecting pod metrics, container logs, and distributed traces. Any OTel-compatible backend can ingest this data, which means you can switch platforms without re-instrumenting your K8s services.
4. What about cloud egress costs for Kubernetes telemetry?
When K8s telemetry goes to any external SaaS platform, your cloud provider charges ~$0.10/GB for data leaving your VPC. At 30TB/month, that is $3,000/month in egress fees alone. This cost scales with cluster activity – more pods mean more telemetry, which means more egress. Self-hosted platforms running inside your VPC eliminate this entirely.
5. Is Datadog better than New Relic for Kubernetes?
Datadog has stronger purpose-built Kubernetes monitoring features – the Kubernetes Explorer, deeper service mesh integrations, and network performance monitoring for container traffic. New Relic has solid K8s support, but its strength is broader full-stack coverage. Both are significantly more expensive than OTel-native alternatives at the same telemetry volume.
6. How long does it take to migrate from New Relic for K8s teams?
Typically 2-4 weeks using a parallel-run approach. Kubernetes teams often find migration easier because their services may already use OTel Collectors or structured telemetry pipelines. The main effort is recreating dashboards and alerts, not re-instrumenting services. Some teams report completing the technical migration in under an hour for individual services.
7. What happens to my New Relic data when I switch?
New Relic retains your data according to your plan’s retention period (8 days on Original plan, 90 days on Data Plus). After that, the data is deleted. Run your new platform in parallel for 2-4 weeks before cancelling to ensure nothing is missed.
Keywords: New Relic alternatives Kubernetes, best observability platform Kubernetes, K8s monitoring tools, cloud-native observability, New Relic alternative for containers, OpenTelemetry Kubernetes, self-hosted APM Kubernetes, CubeAPM, Datadog Kubernetes, Dynatrace Kubernetes